Security Reports
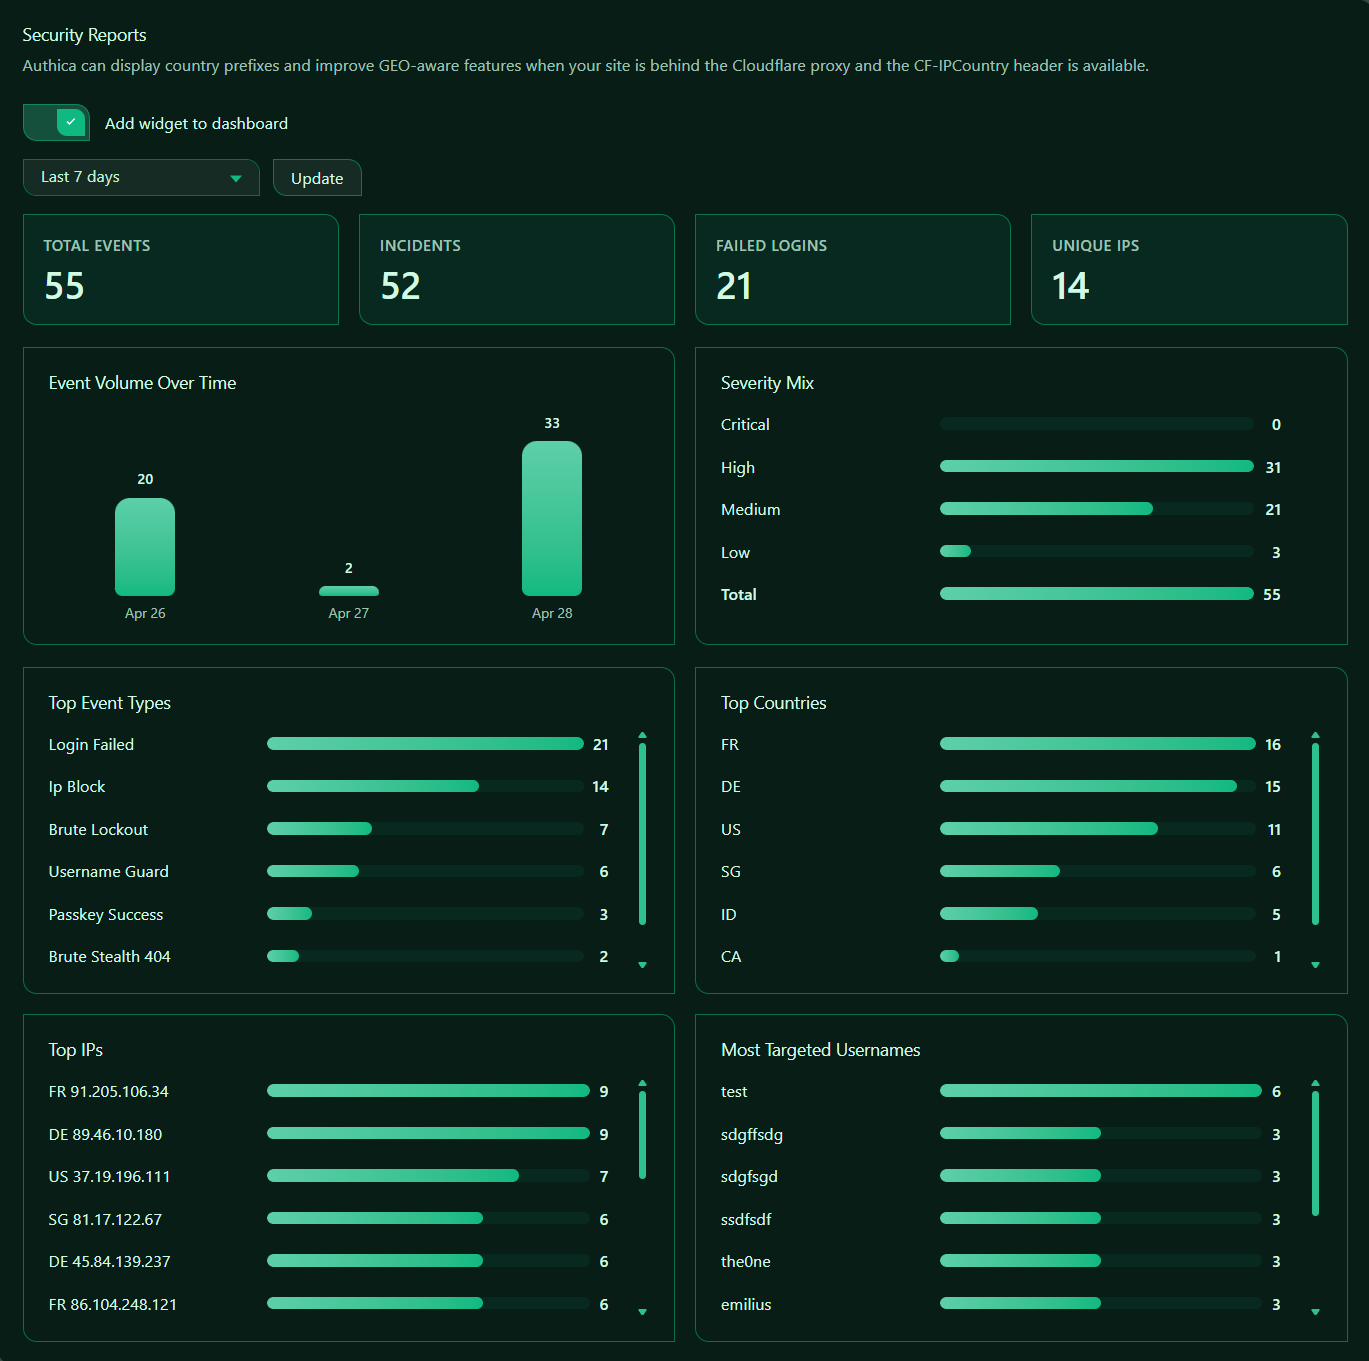
Security Reports gives you a visual summary of Authica security activity over a selected time range.
Instead of reviewing individual log entries one by one, this page groups recent events into charts, totals, and ranked lists. This helps you quickly understand attack volume, failed login activity, top event types, most active countries, most active IPs, and commonly targeted usernames.
Security Reports depends on Authica logging. If logging is disabled, reports may not have enough data to display.
Country Note
Country-based reports work best when:
– Your site is behind Cloudflare
– The DNS record is using the orange-cloud proxy
– Cloudflare is sending the CF-IPCountry header
If your site is not behind Cloudflare, Authica can still report events and IPs, but country data may be unavailable or incomplete.
Add Widget to Dashboard
This option controls whether the Security Reports widget appears on the Authica Dashboard.
When enabled, Authica shows a compact reports widget on the dashboard so you can review security trends without opening the full Reports page.
Recommended setting: Enabled.
Use this if you want quick visibility into recent security activity from the main Authica Dashboard.
Date Range
The date range dropdown controls which period the report should analyze.
Common range options may include:
– Today
– Last 24 hours
– Last 7 days
– Last 30 days
– Custom
Use shorter ranges when investigating recent activity. Use longer ranges when reviewing trends over time.
Update Button
The Update button refreshes the report using the currently selected date range.
Use this after changing the range dropdown or when you want to reload the latest available data.
Recommended usage:
1. Select the desired range.
2. Click Update.
3. Review the updated totals, charts, and ranked lists.
Summary Cards
The summary cards at the top provide a quick overview of the selected reporting period.
Total Events
The Total Events card shows the total number of Authica log events in the selected range.
This includes all counted events for the selected period, depending on your logging configuration.
Use this number to understand overall security activity volume.
Incidents
The Incidents card shows how many events were considered incident-style or security-relevant.
This helps separate more important security events from general activity.
A high incident count may indicate repeated attacks, login abuse, blocked IP activity, or other suspicious patterns.
Failed Logins
The Failed Logins card shows how many failed login events occurred during the selected range.
This is useful for tracking password guessing, brute-force attempts, or users having trouble signing in.
If failed logins are high, review:
– Brute Force Protection
– Username Protection
– IP Restriction
– Recent Activity details
Unique IPs
The Unique IPs card shows how many different IP addresses appeared in the report data.
This helps you understand whether activity is concentrated from a few sources or spread across many IPs.
A high unique IP count may indicate distributed bot activity.
Report Charts and Lists
The report cards below the summary show more detailed breakdowns.
Event Volume Over Time
The Event Volume Over Time chart shows how many events occurred on each day in the selected date range.
Use this chart to identify spikes in activity.
A sudden increase may indicate:
– A brute-force wave
– More blocked IPs
– Bot scanning
– A targeted attack period
– Increased legitimate login traffic
When a spike appears, use Recent Activity with the same date range to inspect the individual events.
Severity Mix
The Severity Mix card groups events by severity level.
This helps you quickly understand how serious the recorded activity was.
Top Countries
The Top Countries card shows which country codes appeared most often in the selected report data.
This helps you understand where security events appear to originate.
Use this card when reviewing:
– GEO Access rules
– Suspicious regions
– Unexpected login activity
– Country-based attack patterns
Important: Country data is most accurate when your site is behind Cloudflare proxy and CF-IPCountry is available.
Top IPs
The Top IPs card shows the IP addresses with the most activity in the selected reporting period.
This is one of the most useful report cards for security review.
Use it to identify:
– Repeated attack sources
– IPs that may need blocking
– IPs triggering repeated login failures
– IPs already handled by IP Restriction or Brute Force Protection
After identifying a suspicious IP, search for it in Recent Activity to see the full event history.
Most Targeted Usernames
The Most Targeted Usernames card shows which usernames were most often involved in suspicious or failed-login activity.
Use this card to identify usernames that bots or attackers are trying.
This is especially useful with Username Protection.
Recommended action:
Add commonly attacked or sensitive usernames to Username Protection when appropriate.
If a real administrator username appears here repeatedly, review your username exposure, author slugs, and 2FA settings.
Scrollable Report Cards
Some report cards can contain more entries than are visible at once.
Cards such as:
– Top Event Types
– Top Countries
– Top IPs
– Most Targeted Usernames
May be scrollable while keeping the card size consistent.
Use the scrollbar inside the card to review additional entries.
Recommended Workflow
A good way to use Security Reports is:
1. Select the date range.
2. Click Update.
3. Review Total Events, Incidents, Failed Logins, and Unique IPs.
4. Check Event Volume Over Time for spikes.
5. Review Severity Mix to understand risk level.
6. Check Top IPs and Most Targeted Usernames.
7. Open Recent Activity to investigate specific IPs, usernames, or dates.
8. Adjust Authica protections if needed.
Recommended Usage
For routine review:
Range: Last 7 days
Review: Total Events, Failed Logins, Top IPs, Most Targeted Usernames
For incident investigation:
Range: Custom
Focus: Event Volume Over Time, Severity Mix, Top IPs, Top Event Types
For GEO review:
Focus on Top Countries and Recent Activity country filters
Best Practices
Recommended best practices:
– Keep logging enabled so reports have data
– Add the reports widget to the dashboard for quick visibility
– Review spikes in Event Volume Over Time
– Investigate repeated IPs in Top IPs
– Watch Most Targeted Usernames for exposed or sensitive usernames
– Use Recent Activity for detailed event investigation
– Keep Cloudflare proxy enabled if you want country-aware reports
Security Reports are most useful when reviewed regularly, not only after a problem happens.
Important Notes
Security Reports are based on stored Authica log data.
If logs are reset, disabled, or trimmed by retention settings, report data may be reduced.
Country reporting depends on available country data. For best results, use Cloudflare orange-cloud proxy so Authica can receive country information through the CF-IPCountry header.